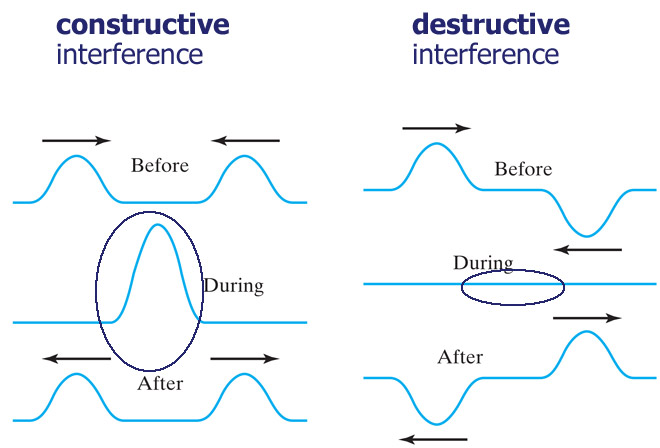
Interference
Waves on the surface of water in 2-d
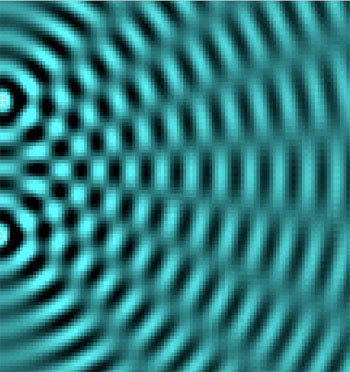 Dipping 2 fingers repeatedly
into a tank of water yields this sort of pattern of interference.
Dipping 2 fingers repeatedly
into a tank of water yields this sort of pattern of interference.
Where two crests meet, the height of the wave should be twice as high as one. Where two troughs meet, twice as low.
Where a trough and crest meet, total cancellation.
In the accompanying diagram:
- The bright spots indicate constructive interference: where two crests meet (one from each source), and the wave height is 2 X the height of one crest.
- The dark spots also indicate constructure interference: where two troughs meet (one from each source). and the wave height is 2 X the depth of one trough.
- The in-between-gray-blue spots indicate destructive interference: where a crest from one source meets a trough from the other source, cancelling each other out.
Interference patterns
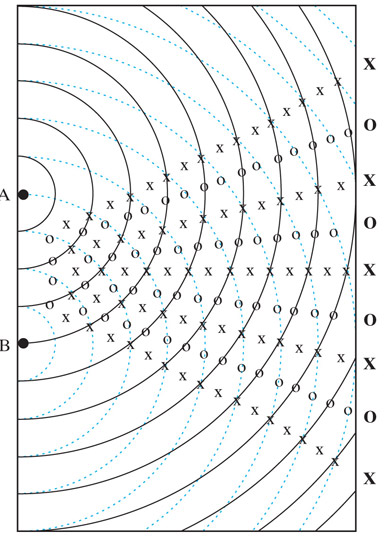 We
can pictorially calculate how this pattern should come out by marking up a diagram
of the wave pattern from the two sources with
We
can pictorially calculate how this pattern should come out by marking up a diagram
of the wave pattern from the two sources with
- "X" at places where crests meet crests (or troughs meet troughs), and
- "O" at places where a crest from one meets a trough from the other.
Young's double-slit
Have the waves from just one source hit a screen with two openings in it. Each opening acts like a "source" in its own right. But now the two "sources" are always in synch with each other, and are guaranteed to have the same frequency (that of the original plane wave coming at the wall).
Homework
You'll use Paul Falstad's ripple tank simulator to explore interference patters.
Two sources (like two slits)
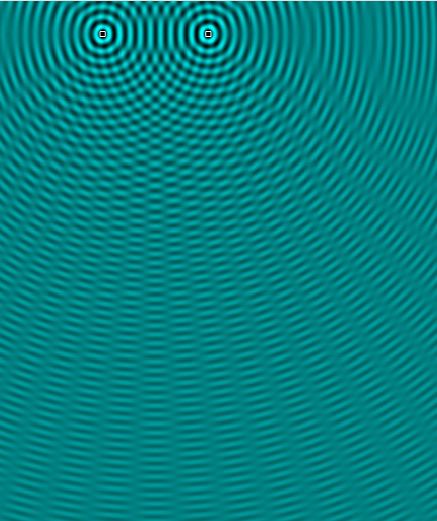
- Choose "Example: Two Sources", set the Source Frequency to the middle of the range.
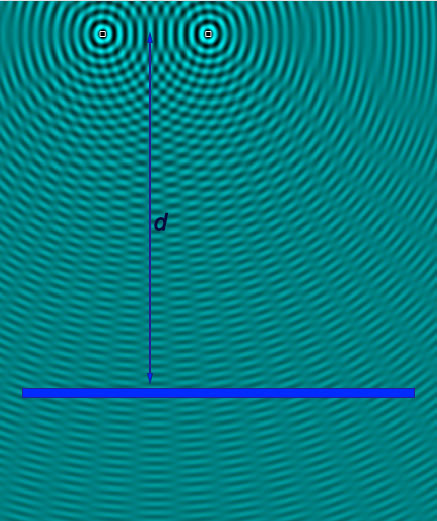
- Now, drag the two sources up to the top of the picture frame
You'll see an interference pattern, with blurry "nodes" between the areas of constructive interference.
Vary the following parameter, and in each case describe how the spacing of the nodes changes (at the bottom of the screen) as you:
- Increase the distance, $a$, between the two sources.
- Decrease the frequency of the waves--this should *increase* the wavelength, $\lambda$ of the waves.
- Now, imagine a line (the thick line in the figure below) which is a distance $d$ away from the two sources. What happens to the spacing between the nodes along the thick line
as you increase $d$ (that is, move your line down towards the bottom of the screen)?
$$\lambda=2d\sin\Delta\theta$$
Single slit
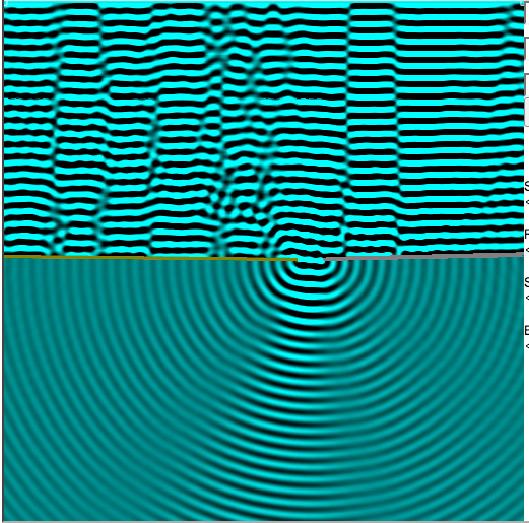
It's a little harder to see patterns here, but play around with just a single slit and describe any regularities that you observe.- Choose "Example: plane wave", set the Source Frequency to the middle of the range.
- Now, Right click with your mouse on the picture to "Add Wall". You'll eventually add a second wall. Move, and drag the ends of the little walls you get to arrange to have just a single slit in a wall which is about a third of the way down the screen.
You'll see a less distinct interference pattern, with blurry "nodes" on either side of an area (in sharper focus) of constructive interference.
Vary the following parameter, and in each case describe how the spacing of the nodes changes (at the bottom of the screen) as you:
- Increase the width of the slit, $w$.
- Decrease the frequency of the waves--this should *increase* the wavelength, $\lambda$ of the waves.
- Now, imagine a line a distance $d$ away from the two sources. What happens
as you increase $d$ (that is, move your line down towards the bottom of the screen)?
$$\lambda=2d\sin\Delta\theta$$