Rates of change
Speed is the rate of change of distance with respect to time. $$s=\frac{\Delta d}{\Delta t}.$$
Check the results of any new calculation against your prior knowledge
What do you know about how fast people walk?
Logger Pro
"Logger Pro" is software installed on the computers in SC 008 that helps you analyze and graph data from videos.
A video is made by taking a succession of snapshots with the camera, "flipping" through them. Email yourself one of the videos you took in Lab 1. Then you can download the video when you're at one of the computers in SC 008.
The program can do many of the tasks that you did to measure speed. It will try to get closer to the "instantaneous speed" by giving you an easy way of measuring how far something moved from one "frame" (still picture) to the next, and give you neat graphs and such.
How does it know how much time has elapsed? Find the "framerate" for iPad moves by looking it up on the Internet...
How does it know the conversion from "screen cm" to "real life inches"? You're going to tell it...
How does it know where the object is to be measured? You're going to tell it...
- Every time you place a point, it will advance by one frame
- You can skip frames and not place a point every frame.
- Erase a point by...1.) Sliding the time back/forth until the point appears yellow 2.)Tap on the yellow point 3.)Delete.
Finally, click the "graphs" icon to see graphs of position and speed.
- What do the graphs mean?
- What's the relation of the distance vs time graph to the speed vs time graph?
- Press "home" and "power" at the same time to take a snapshot of the screen.
More guidelines for getting the speed right??
For Friday
For the same video:
- Snapshot of your earlier calculation based on ruler
measurements on the screen of the average velocity. In your notebook, now, add what you *estimate* to be the average speed based on your Vernier VP graphs (Record your speed in, for example, both inches/sec and your speed estimate converted to miles per hour.)
How to estimate the average speed from the VP graphs? Here are two ways. (Write down which method you used):
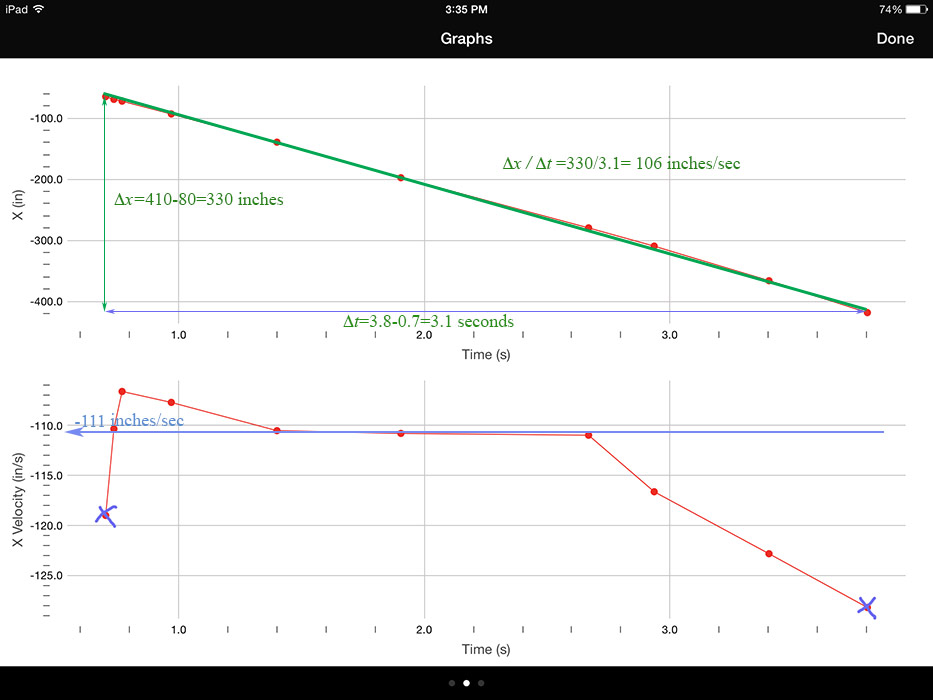
- (Shown at the top) Draw a "best-fit" (by eye) line on the position versus time graph, so that roughly the same number of points are above the line and below the line. Now, find the slope of this line: find the total distance travelled ($\Delta x$, the "rise" in this graph) and the total time taken ($\Delta t$, the "run" in this graph) and divide. This method is shown in green, and the estimate is 106 inches/sec.
- (Shown at the bottom) On the velocity graph, ignore the very first and very last point. Then, draw a horizontal line such that there are just as many points above the line as below the line. This method is shown in blue, and the estimate is 111 inches / sec. (I'm ignoring the negative signs).
- Snapshot of your graph for the appropriate position vs time graph (either $x(t)$ or $y(t)$ depending on how you oriented it).