Ozone hole? - Satellite data
In this group activity (2 people) you'll explore global ozone levels with maps made available by NASA which show calculated ozone levels based on satellite imaging. You'll sample one year's worth of data. Your goal is to identify seasonal patterns in ozone concentrations. What time of year, and roughly (at what latitude) are ozone levels particularly low? particularly high?
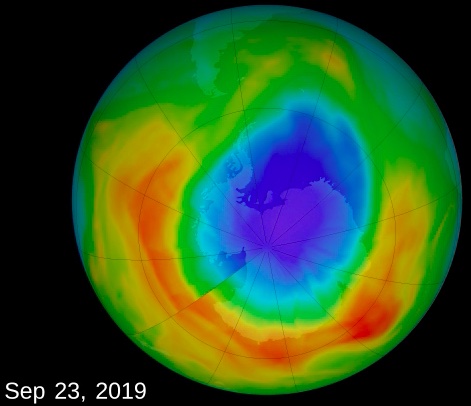
Here's an example map:
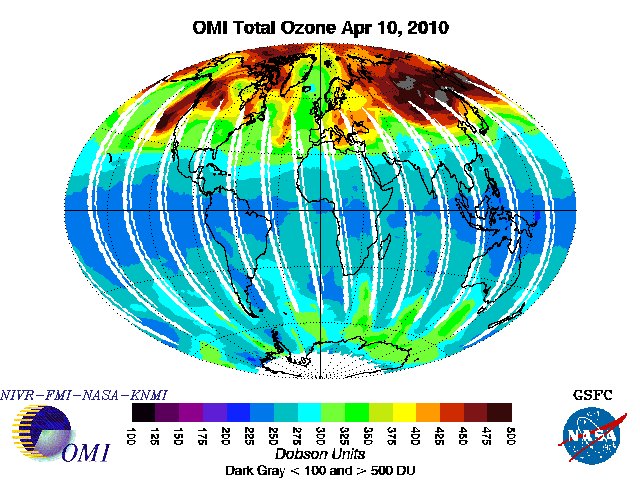
Ozone concentrations are graphed in Dobson units...?
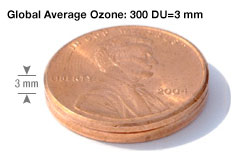 Think about all the air in an imaginary tube extending from sea level to the top of the atmosphere. If you compressed all the air in that tube to the same pressure (the same pressure as air at sea level) it would rise 7 km high.
If you collected just the ozone in that 7km high tube, the global average amount would be a cylinder just 3 mm high = 300 Dobson Units (DU).
Watch some of NASA's satellite maps animated to show you a year's worth of data at a time:
- Type in this URL to your web browser: tinyurl.com/pxlekp5.
You should land at ozoneaq.gsfc.nasa.gov/data/ozone/. - Go to: ozonewatch.gsfc.nasa.gov.
- Look at the "Total Ozone (Dobson units)" color scale at left. What are the colors of the lowest values? Keep this page open in one tab so you can refer back to the scale.
- Open the "multimedia" link (under Ozone Movies) in a new tab to see the whole archive of movies from past years.
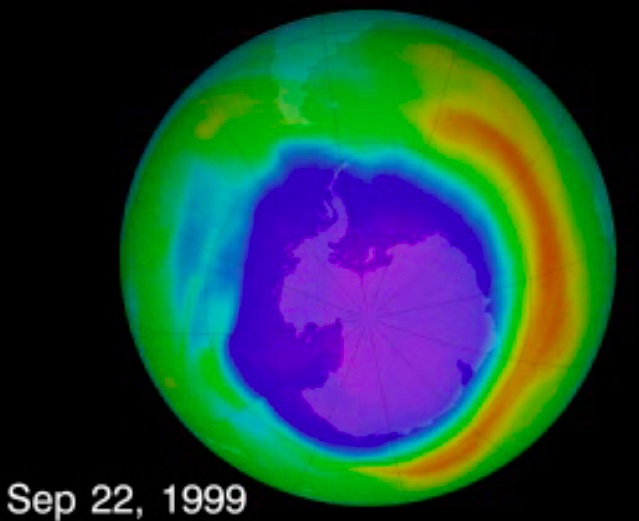
- Watch one of the 1999 movies for the Southern Hemisphere, and one for the Northern Hemisphere. Approximately: When and where on Earth did you find the biggest "ozone hole" with the lowest levels of ozone?
- For the date you found as the biggest ozone hole: What season of the year was it for that hemisphere of Earth?
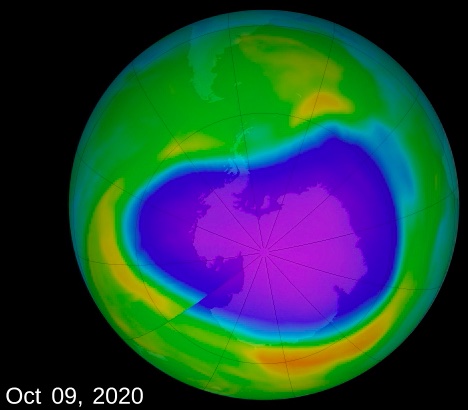
- Was the Ozone hole in 2019 bigger or smaller than in 1999?
Here's the multimedia archive.
See NASA's animation of peak ozone hole (since 1979).
Katharine Hayhoe said that recently the hole hasn't disappeared as rapidly as we thought it might...
- (May 2019) Banned CFCs traced to China (BBC).
- (Oct 2021) Study suggests China's crackdown on illegal CFC gases is working.
When asked by undercover environmental investigators, 18 of 21 companies admitted to using illegal CFCs in construction foams.
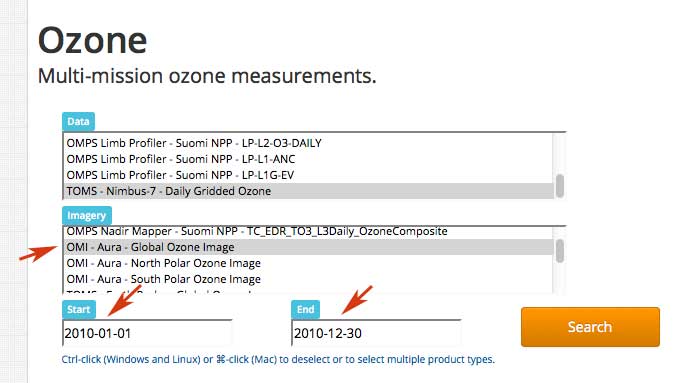
- under Data select "TOMS - Nimbus-7 - Daily Gridded Ozone"
- under Imagery select the "OMI - Aura - Global Ozone Image" option.
- Fill in the Start date and End date of your year.
- Click Search
- Pick some day in January, say for example, January 13. Click on the ".png" map for that date.
-
Make a note of the lowest and highest ozone concentration you find anywhere on the map (in DU), and roughly where (at what approximate latitude) it occurred.
- Repeat the process for the year, picking the same day of the month to look at in February, March, April... Make a table of month, lowest concentration (only the lowest concentration) and approximate latitude where it occurred.
- In what month is the concentration the lowest? Roughly where in the world is that lowest concentration occurring? What season of the year is it in the part of the world where it's thinnest?
- You may notice that the global image doesn't always cover the poles completely. You can select the OMI south or north pole images instead. Look at both of those for the month you picked as the one with the lowest concentration.
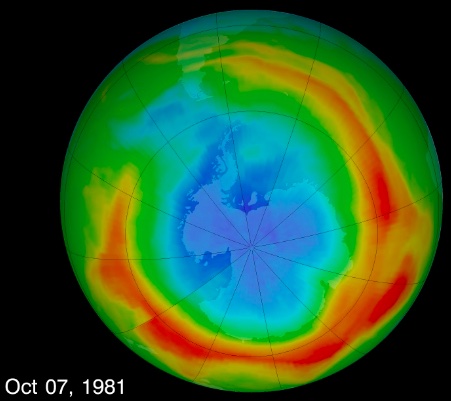
Here are some earlier pictures...
[ozone pics EP/TOMS]