Radiation Monitors
Let's start by *measuring* (monitoring) radiation!
Here is a pdf file to download to your iPad, and then open in Notability to take notes and make observations.
Below are directions for using / setting up the different models of radiation monitors that you'll use at different locations. Download this pdf to one of your iPads as well
Using the radiation detectors
We have a variety of systems to detect radiation. Each one includes a Geiger-Müller (GM) tube. The tube has a thin window on one end. (Treat it with care.) If you think radiation is coming from a particular object, then you want to point the end of the tube with the thin window at the object. Inside the tube is where radiation is detected.
The GM tube is plugged into one of these data gathering/graphing systems:
- A PC running Vernier "Graphical Analysis".
- A handheld "Labquest" unit.
- A handheld "LabQuest 2" unit.
Here's how to use each system.
PC running with Vernier "Graphic Analysis"
If it's not already plugged in, plug a "GoDirect Radiation Monitor" in to one of the USB ports in the computer (on the back of the monitor). Also, switch on the speaker. The switch is close to the GM-tube part of the monitor.
 If the "Graphic Analysis program isn't already running, find this icon on the desktop and double-click it to start the data collection program.
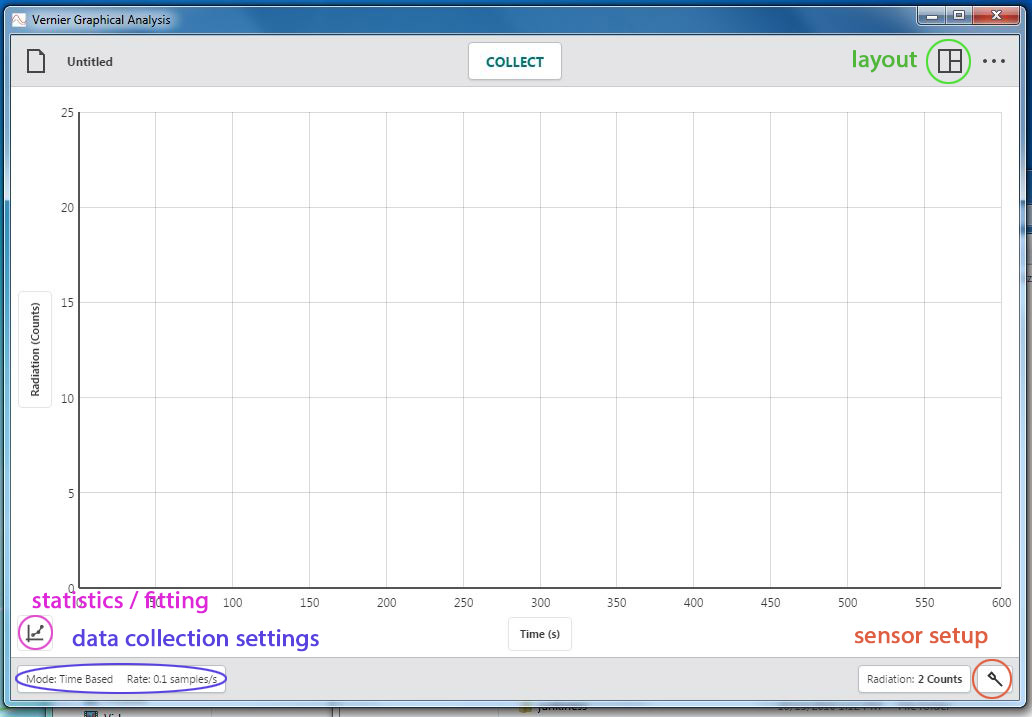
This is what the screen should look like when you start it up. Click on the sensor setup icon. Verify that the program is aware of the GoDirect radiation monitor.
Now, click on the data collection settings button on the screen. Configure the screen to look like this:
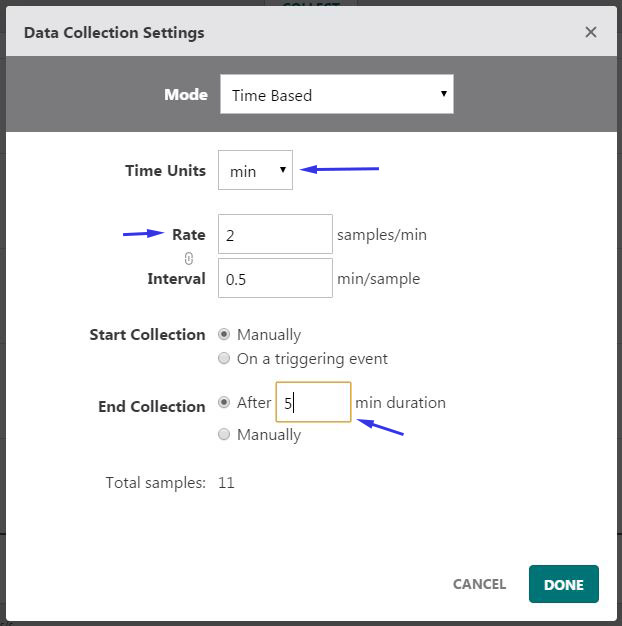
- Change the Time Units to "minutes" if necessary.
- Change the Rate to 2 samples per minute. (The Interval will automatically change to 0.5 min/sample.
- Set End Collection to "After 5 min duration.
and click DONE. You'll be set to collect data for 5 minutes.
Back on the main screen, click COLLECT to start collecting data. You'll have to wait 30 seconds before the first data point on the graph comes in.
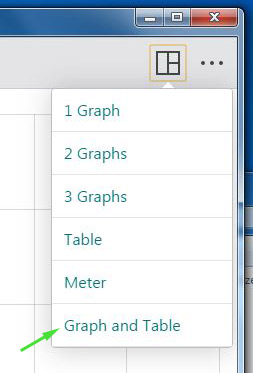 While the experiment is running, click the layout button. On the screen that appears, choose Graph and Table.
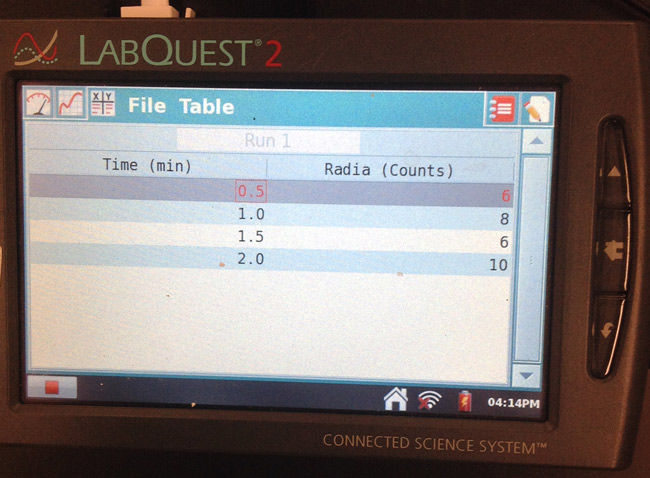
After a while the screen will look like this:
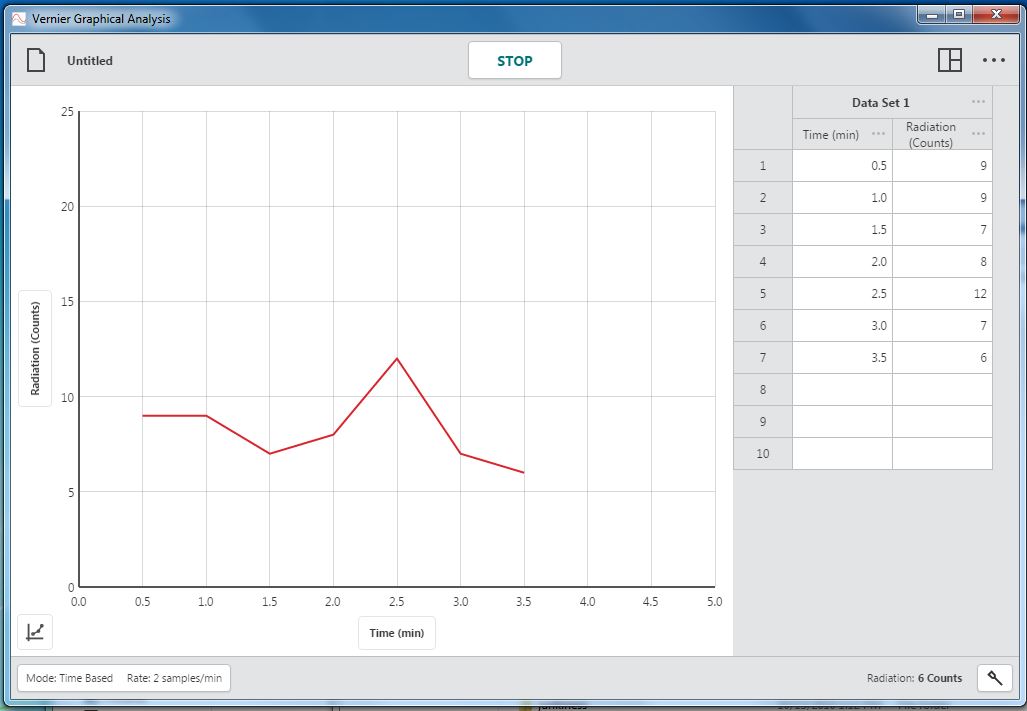
You'll see a table with the time in the first column (corresponding to the $x$-axis of the graph) and the counts in the second column (graphed according to the $y$-axis).
To start another data collection run click Collect again. A new set of columns will be started.
Using the LabQuest
There are LabQuest (older) and LabQuest 2 (newer) units. They work very similarly. A GM tube should be plugged into one of the ports on the side labelled DIG 1. (On the LabQuest 2, this is behind a flap).
This is what the screen looks like initially
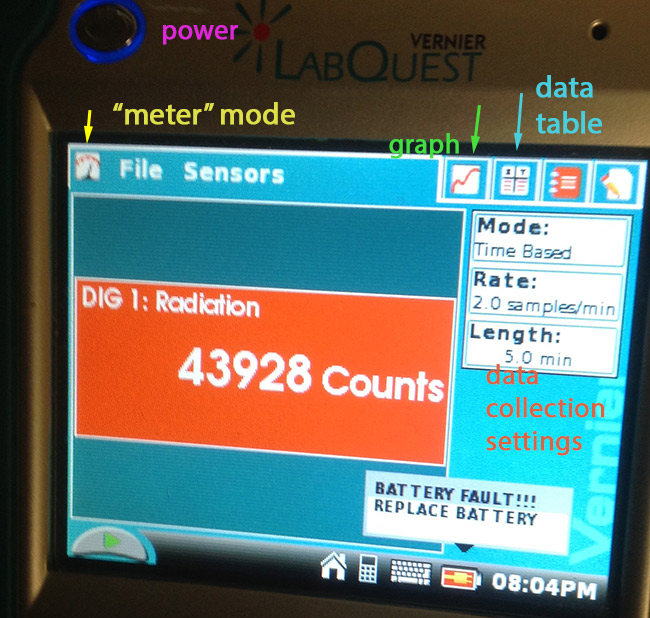
You can tap the screen with a finger or the non-writing end of any pen or the plastic stylus to select options on the touch screen.
Click anywhere in the data collection settings part of the screen. Change the time units (to min), the Rate and Length settings to match these settings:
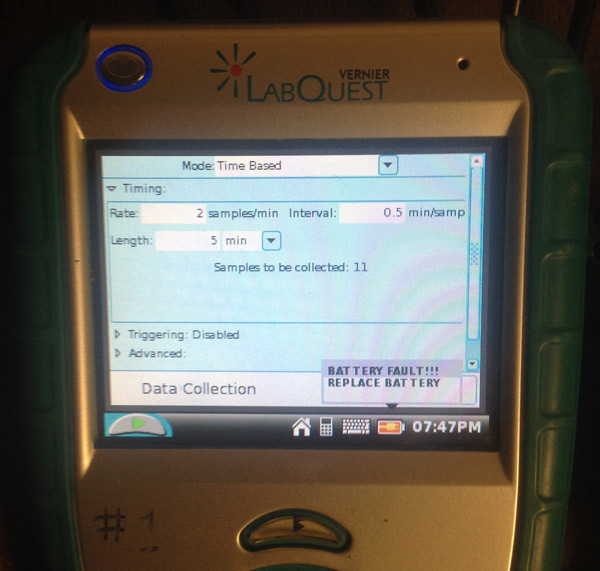
(The "Interval" setting should set itself when you set the Rate.)
Click the "Battery Fault" message to make it go away, if necessary. Click "Done".
To start data collection, click the green arrow on the screen, or press the arrow key below (or beside) the screen. It will take a little while (30 seconds, to be exact) before the first point on the graph will be displayed.
You can switch to view a table of data values at any time.
If you need to stop a data run, click the red square shown above.
To start a second data collection run, tap on the green start icon once more. "Discard" any old files when you start a new run.