Functions of two variables
A function $f$ of two variables is a rule that assigns to each ordered pair of real numbers $(x,y)$ in a set $D$ a unique real number denoted by $f(x,y)$.
In this topic we'll look at:
- dentifying the domain (and range) of functions of 2 variables.
- Traces and contours / contour plots - visualizing functions of 2 variables.
Domains
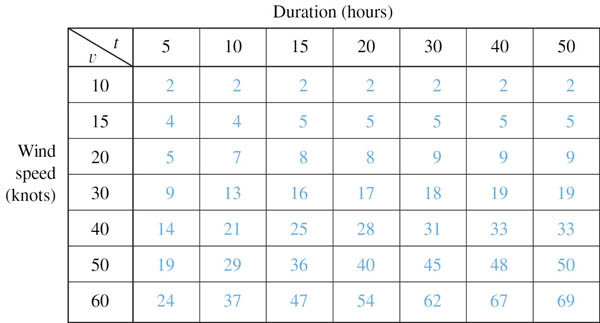
$f(x,y)$ in tabular form
$h(v,t)$: A table of wave
height, h (in feet) which depends, in the open ocean, on the speed, $v$, (in knots) of the wind and how long, $t$, (in hours) it's been blowing.
[October, 2013 -- Cyclone Phailin hits east India]
Domains - graphically
- The set $D$ is the domain of the function $f$.
- The range of $f$ is the set of values that $f$ takes on, that is, the set: $\{f(x,y)|(x,y)\in D\}$.
Often we write such a relation in terms of a dependent variable $z\equiv f(x,y)$ which is a function of the two independent variables $x$ and $y$.
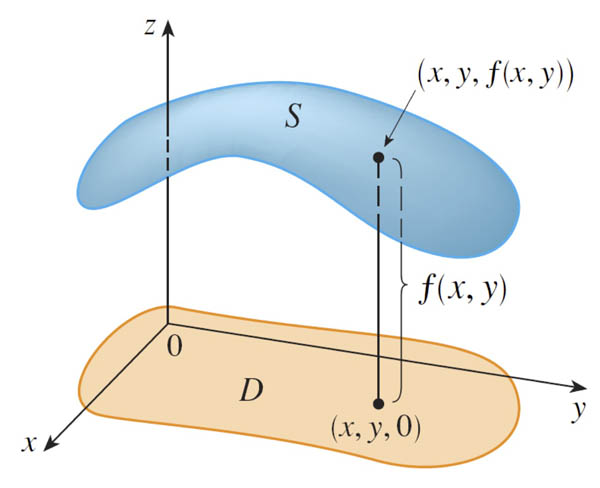
If $f$ is a function of two variables with domain $D$, then the graph of $f$ is the set of all points $(x,y,z)$ in $\mathbb{R}^3$ such that $z=f(x,y)$ and $(x,y)$ is in $D$.
Schlicker, 9.1 exercises
4, 17a and Activity 9.1.2*
Traces
Consider a ball launched from "floor level". Let's assume it's launched with speed $x$ (m/s) at an angle $y$ (radians) above horizontal. To the extent that we can neglect air resistance, the horizontal distance (in meters) that the ball travels, under the influence of the earth's gravity ($g=9.8$ m/s^2) before again landing at floor level is this function of the launch speed and angle:
$$f(x,y)=\frac{x^2\sin y}{9.8}.$$
If we take the $z$ coordinate to represent $f(x,y)$, then the graph of the points which satisfy this equation $z=\frac{x^2\sin y}{9.8}$ forms a 3-d surface that looks like this:

If we wanted to visualize what this surface looks like without resorting to snazzy plotting programs, a common technique is to set one of the variables to a constant value, and then see what the resulting 2-d graph looks like. For example:
 An x=150 trace: What happens if consider only launching the ball with an initial speed of $x=150$ m/s, but than ask how changing the angle $y$ affects the horizontal distance travelled, $z$? We substitute 150 in for $x$ in our equation, and are left with a function of just one variable $z(150,y)=\frac{150^2\sin(2y)}{9.8} \approx 2300\sin(2y)$. This is a sine function which is 0 when $y=0$ or $y=\pi/2$, and reaches a maximum value when $y=\pi/4=45^{0}$. The graph of this $z(y)$ is the red line on the surface graph shown.
 A y=0.6 trace: What happens if consider only launching the ball at an initial angle of $y=0.6$ radians, but than ask how changing the launch speed $x$ affects the horizontal distance travelled, $z$? We'll consider
$z(x,0.6)=\frac{x^2\sin(2\cdot0.6)}{9.8} \approx $. This is a parabola with it vertex at $x=0$. The distance, $z$, is proportional to $x^2$, the square of the initial speed.
The graph of this $z(x)$ is the red line on the surface graph shown.
A y=0.6 trace: What happens if consider only launching the ball at an initial angle of $y=0.6$ radians, but than ask how changing the launch speed $x$ affects the horizontal distance travelled, $z$? We'll consider
$z(x,0.6)=\frac{x^2\sin(2\cdot0.6)}{9.8} \approx $. This is a parabola with it vertex at $x=0$. The distance, $z$, is proportional to $x^2$, the square of the initial speed.
The graph of this $z(x)$ is the red line on the surface graph shown.
Trace as intersection with a plane
We know that $x=0.6$ is the equation of a plane, consisting of all of the points in 3-d space with an $x$-coordinate of 0.6. This is a plane parallel to the $y-z$ plane at $x=0$. So we might call it "a" $y-z$ plane at $x=0.6$
An $x=k$ trace
For the surface specified by $f(x,y)$, An $x=k$ trace can be thought of as either:
- The 2-d graph of $z(y)\equiv \left.f(x,y)\right|^{x=k}=f(k,y)$, -OR-
- The curve traced out by the intersection of the surface $f(x,y)=z$ with the plane $x=k$.
I think you can see how to change this, to define a $y=k$ trace.
Graphing surfaces with Geogebra
Here's a geogebra graph of the surface $z(x,y)=\frac{x^2\sin(2y)}{9.8}$. There are at least two ways to graph a function in Geogebra:
- Simple: as an equation connecting 1 or more of $x$,$y$ and $z$ which all the points to be graphed must satisfy. For example:
x^2+y^2=9
or
z=x^2*sin(2*y)/9.8 - More control: as a parametric plot, specifying equations for $x$, $y$, and $z$ in terms of two independent variables, with limits on their values:
Surface(3,y,z,y,-5,5,z,0,5)
or
Surface(x,y,x^2*sin(2*y)/9.8,x,0,250,y,0,pi/2)
NOTICE that geogebra changes $x\to u$, and $y\to v$ to "coordinate-agnostic" parameters $u$ and $v$. You are free to specify the points belonging to the surface as $(x(u,v), y(u,v), z(u,v))$.
- Open the geogebra drawing of our surface at the link above.
- Open the left-hand panel (click on "algebra" if it's not open).
- In a new cell, add the equation which defines the $x=150$ plane as x=150. Observe the intersection of the two surfaces.
- Delete the cell you just created (go to its hamburger menu). Then add the equation for the $y=0.6$ plane. Does this match the graph in the notes?
- Now add a slider in a new cell, called $k$. Start by typing k=slider(. You should see some hints of how to specify a minimu and maximum value. Set things up so that $0\lt k \lt \pi/2$. Finally, set up a cell with $y=k$, to control the value of the plane with your slider.
More practice with traces
For the function... $$\nonumber z=f(x,y)=y^2-x^2$$
- Describe what the $x=k$ traces look like.
- Describe what the $y=k$ traces look like.
- Can you picture what the surface looks like??
- Graph the surface in geogebra.
Schlicker, 9.1 exercises
12, 13, 15
Level curves and contour plots
Maybe it occurred to you to look at what the intersection of a $z=k$ plane looked like with either of the surfaces above?
Sure! Why not?! We could call this is a $z=k$ trace.

The dome atop the German Reichstag (Parliament) in Berlin. The original dome was burned by the Nazis
in the run-up to their takeover of the democratic Weimar Republic. Some parallels with the U.S. Jan 6 moment! This replacement dome was completed after German reunification (finished in 1999).
What would some $z=k$ traces of the surface of the Reichskuppel look like?
Contour plots

The top of this figure is a contour plot (several labelled $z=k$ traces. The bottom is a single $y=k$ trace.
A single $z=k$ trace of a surface is also called a contour.
Probably some of you are familiar with a contour plot which is a set of contours, which each contour labelled with the value $k$ it represents.
Hikers love "topographic maps". This is a 2-d (paper or phone screen) representation of the surface of earth, where $k$ usually represents the height of Earth's surface (in meters or feet) above sea level.
To calculate a contour: You would set $f(x,y)$ equal to a particular k, and solve for $y(x)$. For example, for our surface $z=x^2-y^2$, pick $z=k=9$, and consider $9=x^2-y^2$. Solving for $y$, we get
$$\nonumber y=\pm\sqrt{x^2-9}$$ which looks like...

Schlicker, 9.1 exercises
2, 3, 8, 15, 17, Porcupine mountain* (Their contour plot is hard to read, You can use this Google map centered on a point somewhere in the Porcupine Mountains instead. Just switch to the Terrain view if the contours are not showing.)