Freefall lab results
You dropped light and heavy objects. Did they fall the same?
We tweaked that question to look at
- Distance vs time graphs
- Speed vs time graphs
Data
You have a summary of the data on paper. I'll show some examples from previous classes to illustrate things...
First stage in looking at the data:
Keep all the data?
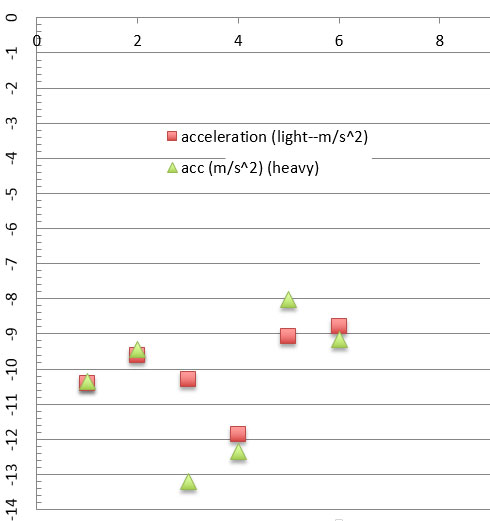
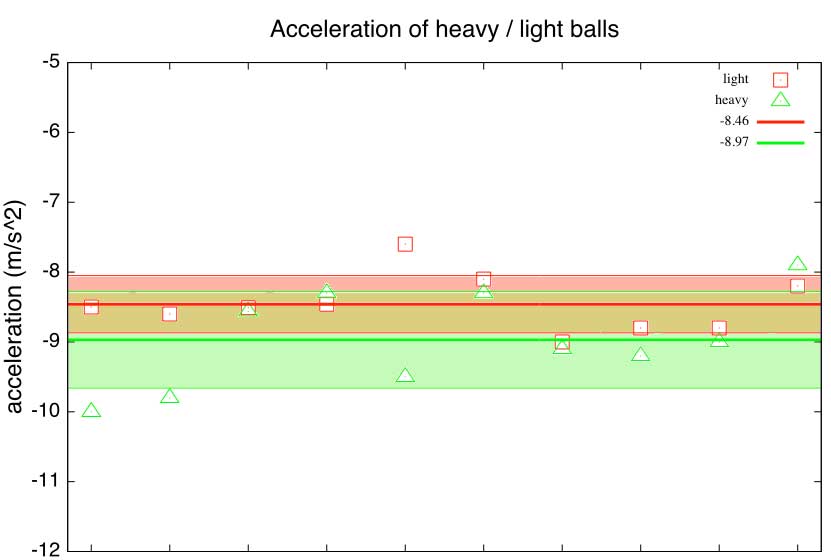
- The horizontal axis is just the number of the measurement.
- The vertical axis is the measured accelerations, in
Draw and label a horizontal line at the class average acceleration for the light objects. Do the same for the heavy object average.
Do those look like they are "in the middle" of the light/heavy object data?
Averages
The average 2015 accelerations were light objects: -8.46
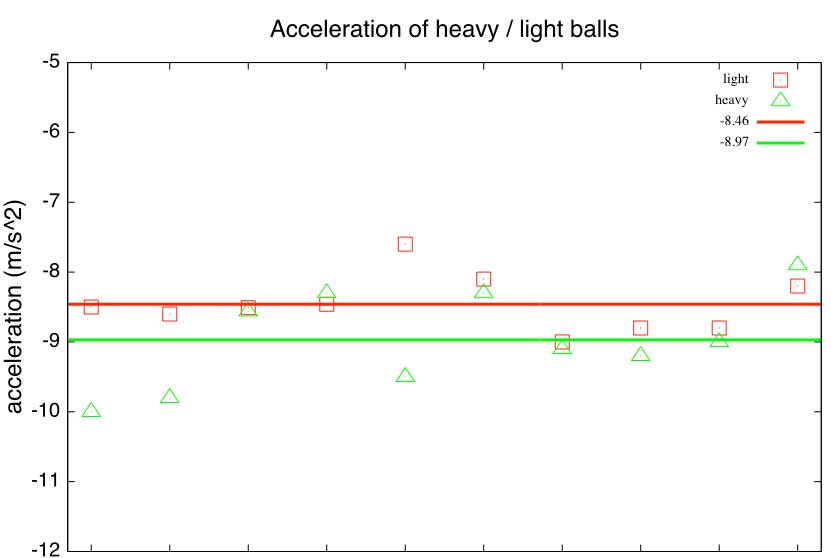
Which kind of object appears to fall with a greater acceleration based on the averages?
Uncertainty
Repeated measurement of the same thing does not always give the same result.
There is a standard way to quantify the uncertainty in a set of repeated measurements. Here goes...
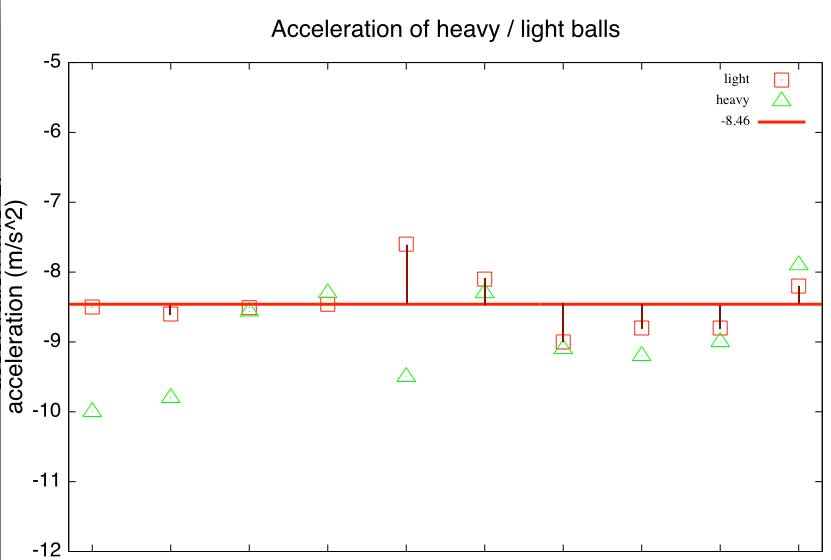
The brown bars are the deviations of each data point from the average.
The overall uncertainty seems like it should be related to
some sort of "average deviation". The most common way to calculate this sort of thing is to calculate the standard deviation, "
- Find the deviation for each data point,
- Square it.
- Find the average of those squared deviations.
- Take the square root of that average.
This quantity is called the standard deviation, which is written as
In a statistics course you'll find that for typical experiments, if you measure a quantity
I'll round this and call it the "70% rule".
Another way to put this: 70% of the time, the "real value" of some physical quantity will be found between
For the 2015 light object data,
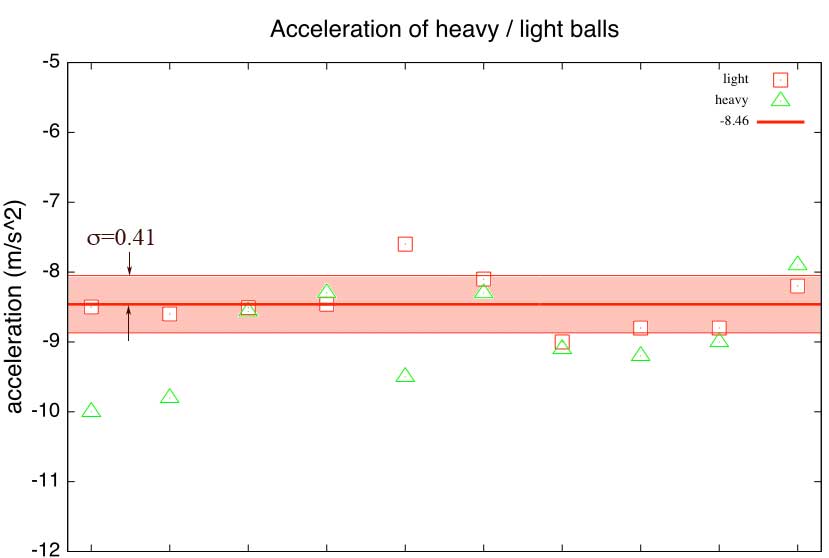
This range is typically the size of the "error bars" on a graph.
Your data - Mark horizontal lines such that you *include* 70% of your data points. Or, another way of saying that is that you want to *exclude* 30% of your data points. at
Which has a greater downward acceleration?
Time to look at the data again comparing heavy and light objects (together with variation). For the heavy objects,
The minimum for measurements of quantities to be considered to be giving two different values is that the error bar ranges of each quantity should not overlap.
What do you conclude?
Sources of uncertainty
What might be the sources of uncertainty in this measurement of accelerations?
After many, many experiments, of this sort, what do professional scientists think?...
About standard deviation
A take home message about standard deviation & uncertainty...
You can estimate
In this course you will *not* estimate standard deviations by calculating the sum of the squared deviations, but instead you should be able to use this visual interpretation of the "70%" rule:
- Calculate or estimate the average value of a set of measurements.
- Count the number of measurements you have, and figure out 70% of the number of measurements you have made.
- Draw error boundaries equally far above and below the average value, so as to include 70% of your data points.
- The distance from your lower boundary to your upper boundare is
Falling objects and GravE
Talking about lifting books onto shelves...
- To lift a book you need to "do work" on it, equal to
- We asked "where does the energy go"?:
- Answer:
 Now, what if we drop the book off the shelf.
Every second that an object is falling it is losing GravE.
Where does that energy go???
Hint: what is changing while the object is falling?