Lab 07
Pre-Lab
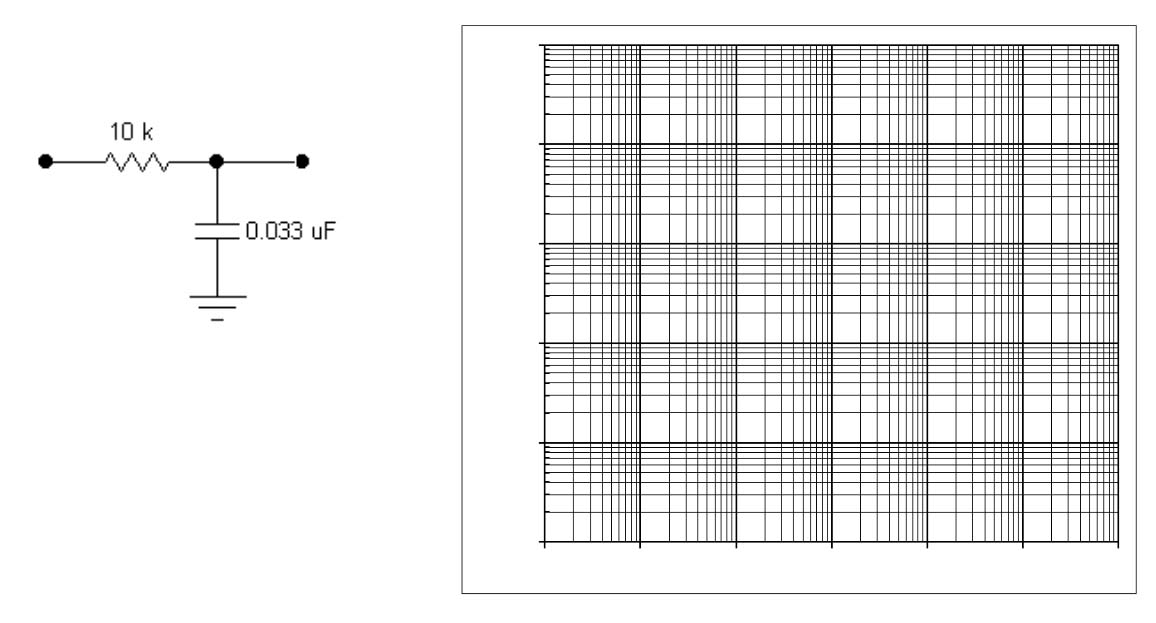
Draw the Bode plots for the following circuits. Calculate the corner frequency $f_\text{3dB}$, then choose a good scale range, label the axes, then draw the plot.
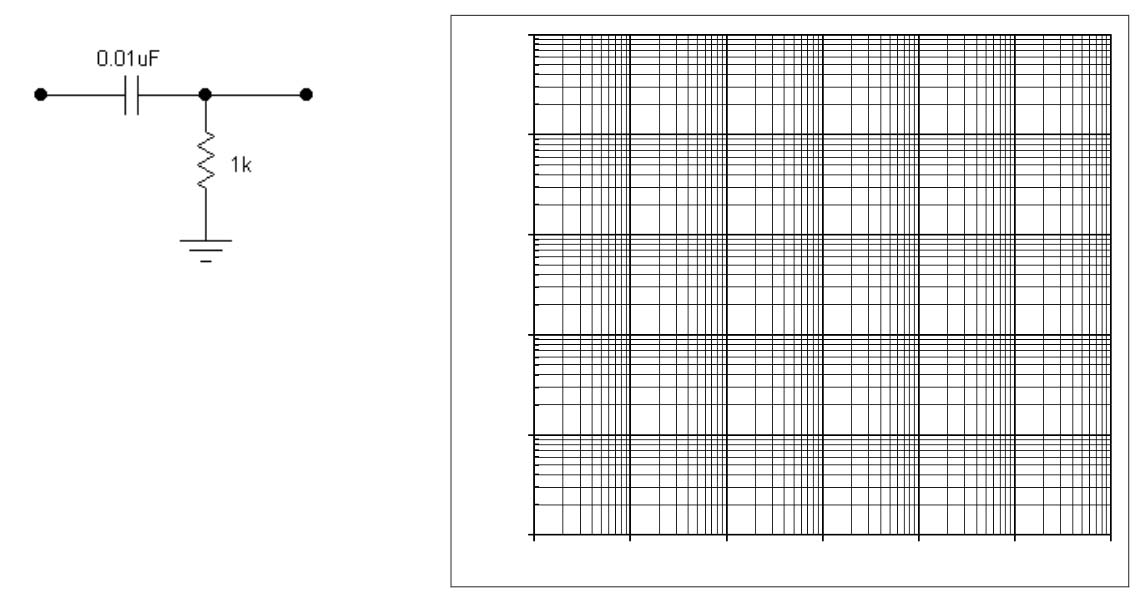
Here is a .pdf file of this page for you to edit in Notability with your plots.
Lab 07 - Capacitors and Filters
- High-Pass Filter (50 min)
-
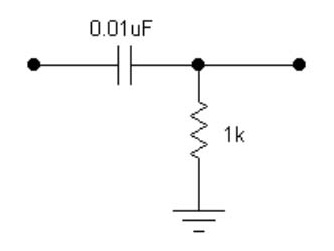 Build the high-pass filter shown at right.
Apply sine waves of three frequencies (1/10, 1, 10 )$\times
f_\text{3dB}$. Record $V_\text{out}$ and $V_\text{in}$ for each
frequency. Make a copy of your calculated Bode Plot (first part of
the Pre-Lab) and plot your measured ratios of
$\frac{V_\text{out}}{V_\text{in}}$ vs frequency on your Bode Plot
copy.
$\ \cdot\ $ Does it agree with your calculated Bode plot or not
so much? $\ \cdot\ $ Describe the function of the circuit.
Build the high-pass filter shown at right.
Apply sine waves of three frequencies (1/10, 1, 10 )$\times
f_\text{3dB}$. Record $V_\text{out}$ and $V_\text{in}$ for each
frequency. Make a copy of your calculated Bode Plot (first part of
the Pre-Lab) and plot your measured ratios of
$\frac{V_\text{out}}{V_\text{in}}$ vs frequency on your Bode Plot
copy.
$\ \cdot\ $ Does it agree with your calculated Bode plot or not
so much? $\ \cdot\ $ Describe the function of the circuit.
Next Apply a square-wave (from the generator) to the input and look at the output. Take a picture of the oscilloscope trace of the input and output at low, and high frequencies (relative to its cut-off). $\ \cdot\ $ If you have a B&K Signal Generator, use the offset on the generator (pull the knob out to activate this function and then turn it) and see what happens when the signal has a DC component, (if you don’t, find a group that does and either trade or just look at their signals as they do this part. Describe the result. $\ \cdot\ $ Disconnect the lower end of the resistor from ground and connect it instead to +5V. How does the output behave now?
-
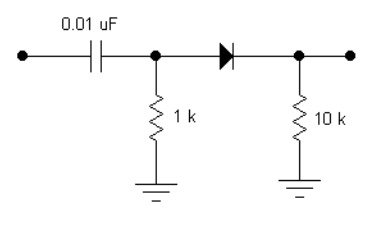 Build the circuit with the added diode and resistor shown at
right. Drive the circuit with a square wave of 1 kHz frequency.
First use your scope to look at the point just after the capacitor but
before the diode. Then look at the output of the circuit. Explain
the action of the diode part of the circuit. $\ \cdot\ $ Now remove
the 1 k resistor from the circuit. Why does it no longer work?
Build the circuit with the added diode and resistor shown at
right. Drive the circuit with a square wave of 1 kHz frequency.
First use your scope to look at the point just after the capacitor but
before the diode. Then look at the output of the circuit. Explain
the action of the diode part of the circuit. $\ \cdot\ $ Now remove
the 1 k resistor from the circuit. Why does it no longer work?
-
- Low-Pass Fleter (25 min)
-
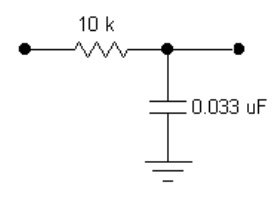 Keep the above circuit on one part of the breadboard. On a different part of the board, build the Low-Pass filter shown. Apply sine waves of three frequencies (1/10, 1, 10 )$\times f_\text{3dB}$
As above, record $V_\text{out}$ and $V_\text{in}$ for each
frequency. Make a copy of your calculated Bode Plot (second part of
the Pre-Lab) and plot your measured ratios of
$\frac{V_\text{out}}{V_\text{in}}$ vs frequency on your Bode Plot
copy. Describe the circuit's behavior.
$\ \cdot\ $ Apply a square-wave at the input and look at the output. Draw quick sketches or take photos of the input and output at low, and high frequencies (relative to its cut-off). $\ \cdot\ $ Use the offset on the generator (or look at someone who can) and describe what happens when the signal has a DC component.
Keep the above circuit on one part of the breadboard. On a different part of the board, build the Low-Pass filter shown. Apply sine waves of three frequencies (1/10, 1, 10 )$\times f_\text{3dB}$
As above, record $V_\text{out}$ and $V_\text{in}$ for each
frequency. Make a copy of your calculated Bode Plot (second part of
the Pre-Lab) and plot your measured ratios of
$\frac{V_\text{out}}{V_\text{in}}$ vs frequency on your Bode Plot
copy. Describe the circuit's behavior.
$\ \cdot\ $ Apply a square-wave at the input and look at the output. Draw quick sketches or take photos of the input and output at low, and high frequencies (relative to its cut-off). $\ \cdot\ $ Use the offset on the generator (or look at someone who can) and describe what happens when the signal has a DC component.
-
- Composite Signal to Test Filters (25 min)
-
 Create a composite signal to test your filters. As shown, float
the “top” signal generator by making sure it has only a two prong
ungrounded plug (if necessary use a cheater). Then connect the
“ground” side of its output to the output of the signal generator on
the board thus stacking the two signals. The external generator’s
output is now the sum of the two. Look at it on the scope. Show your
composite signal to your lab instructor to be sure you’ve got it right.
Take a photo of your composite signal for your Note, and write down the two frequencies.
Create a composite signal to test your filters. As shown, float
the “top” signal generator by making sure it has only a two prong
ungrounded plug (if necessary use a cheater). Then connect the
“ground” side of its output to the output of the signal generator on
the board thus stacking the two signals. The external generator’s
output is now the sum of the two. Look at it on the scope. Show your
composite signal to your lab instructor to be sure you’ve got it right.
Take a photo of your composite signal for your Note, and write down the two frequencies.
- Test the Hi-pass filter first (just the plain high-pass, without the diode and 10 k part). Feed the composite signal into it. This time set the one generator to 50 kHz and 1 V p-p sine wave representing the desired signal. Set the second generator to 500 Hz and 1 V p-p sine wave representing some low frequency interfering signal. Look at the composite signal on the input and the filtered signal at the output. Does the filter work? $\ \cdot\ $ What if the interfering signal is 2 kHz or 10 kHz or 20 kHz?
- Test your Lo-pass filter next. Set the one generator to 60 Hz and 1 V p-p sine wave representing the desired signal. Set the other generator to 20 kHz and 1 V p-p sine wave representing a high frequency interfering signal. Look at the composite signal on the input and the filtered signal at the output. Does the filter work? $\ \cdot\ $ Take a scope picture. $\ \cdot\ $ What if the interfering signal is 5 kHz or 1 kHz or 200 Hz?
-
-
Scope Silliness (if time permits)
Play a bit with interference signals into the scope:
- Take a scope probe and touch the probe tip with your finger. Set the vertical scale to look at tiny signals. If you use LINE triggering and slow sweep speeds you should see a 60 Hz freak show. While touching the input, reach around near other things.
- Now ground yourself by touching one hand to a grounded metal object while still touching the probe with the other. This reduces the 60 Hz signal but you’ll still see other hash. Next, go to really high sweep speeds and you’ll see WKAM at 1.460 Mhz (the nearest and strongest AM station). The blurring and dancing of this signal is the audio modulation signal that should be in time with the radio.
- WGCS is at 91.1 MHz, figure out the period of the signal and then set the scope for an appropriate sweep speed. Your scope is either 50 or 60 MHz meaning it has a low pass roll-off at that frequency. So if you see the WGCS signal it will be somewhat attenuated. We do have one digital scope that goes to 200 Mhz.