Functions and surfaces [9.6]

Dome atop the German Reichstag in Berlin
Functions of more than one variable.
$f(x,y)$
A function $f$ of two variables is a rule that assigns to each ordered pair of real numbers $(x,y)$ in a set $D$ a unique real number denoted by $f(x,y)$.
- The set $D$ is the domain of the function $f$.
- The range of $f$ is the set of values that $f$ takes on, that is, the set: $\{f(x,y)|(x,y)\in D\}$.
Often we write such a relation in terms of a dependent variable $z=f(x,y)$ which is a function of the two independent variables $x$ and $y$.
Examples
- Surface temperature, $T(x,y)$, varies with latitude ($y$) and longitude ($x$).
- Height, $h(x,y)$, above sea level on Earth's surface varies with latitude and longitude.
Tabular form
$h(v,t)$: A table of wave
height, h (in feet) which depends, in the open ocean, on the speed, $v$, (in knots) of the wind and how long, $t$, (in hours) it's been blowing.

[We had Cyclone Phailin (Oct 2013) and now (May 2019) here comes Cyclone Fani]
Graph
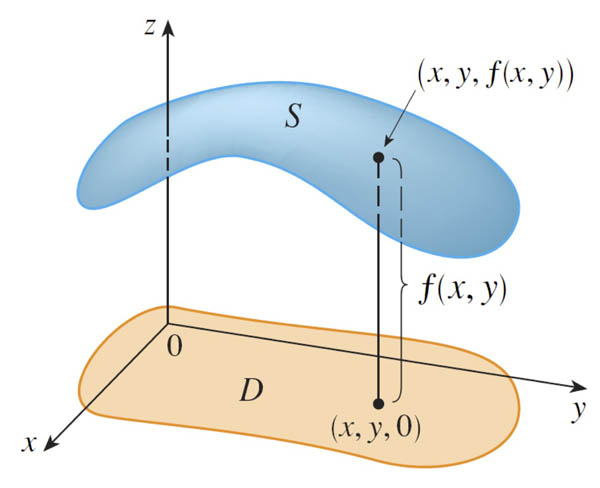
If $f$ is a function of two variables with domain $D$, then the graph of $f$ is the set of all points $(x,y,z)$ in $\mathbb{R}^3$ such that $z=f(x,y)$ and $(x,y)$ is in $D$.
Examples
 $$\nonumber z=f(x,y)=6-3x-2y$$
[Verify the intersections with the $x-$, $y-$, and $z-$axes.]
$$\nonumber z=f(x,y)=6-3x-2y$$
[Verify the intersections with the $x-$, $y-$, and $z-$axes.]
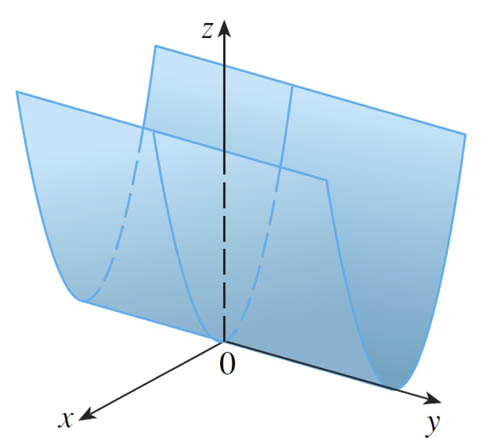
$$\nonumber z=f(x,y)=x^2$$
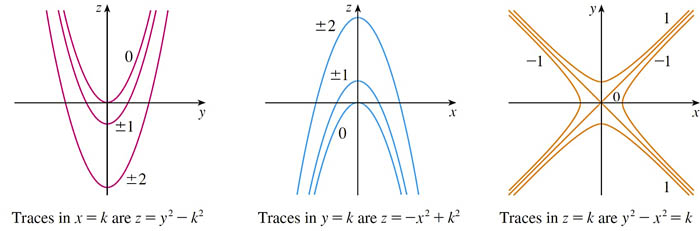
Traces

$$\nonumber z=f(x,y)=y^2-x^2$$
It is helpful to visualize surfaces by considering intersections of the surface with various planes:
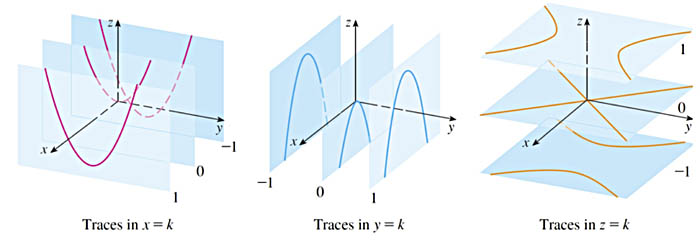
- Vertical traces are intersections with some vertical plane like $x=k$ or $y=k$.
- Horizontal traces are intersections with a horizontal plane like $z=k$. (The contours on a contour map are usually horizontal traces of the height above sea level.)
To do
- Staying Cool
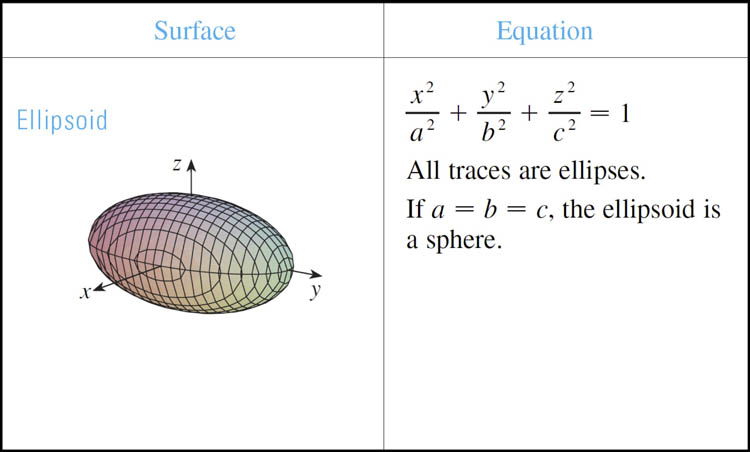
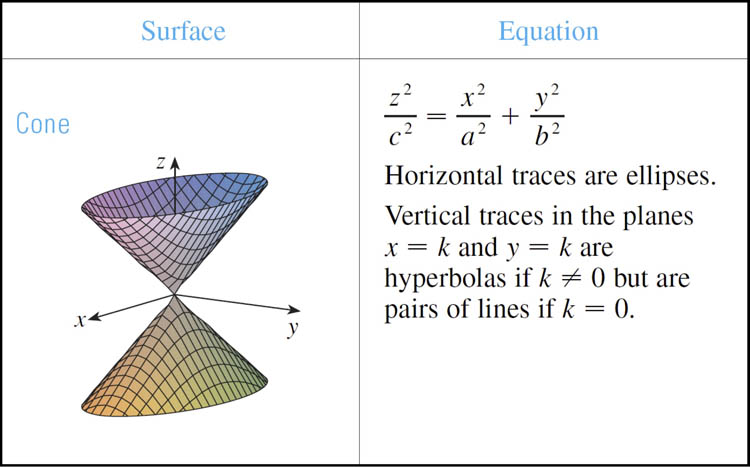
Quadric surfaces
To do
- Matching Game - general functions
- Matching Game - quadric functions