Maps
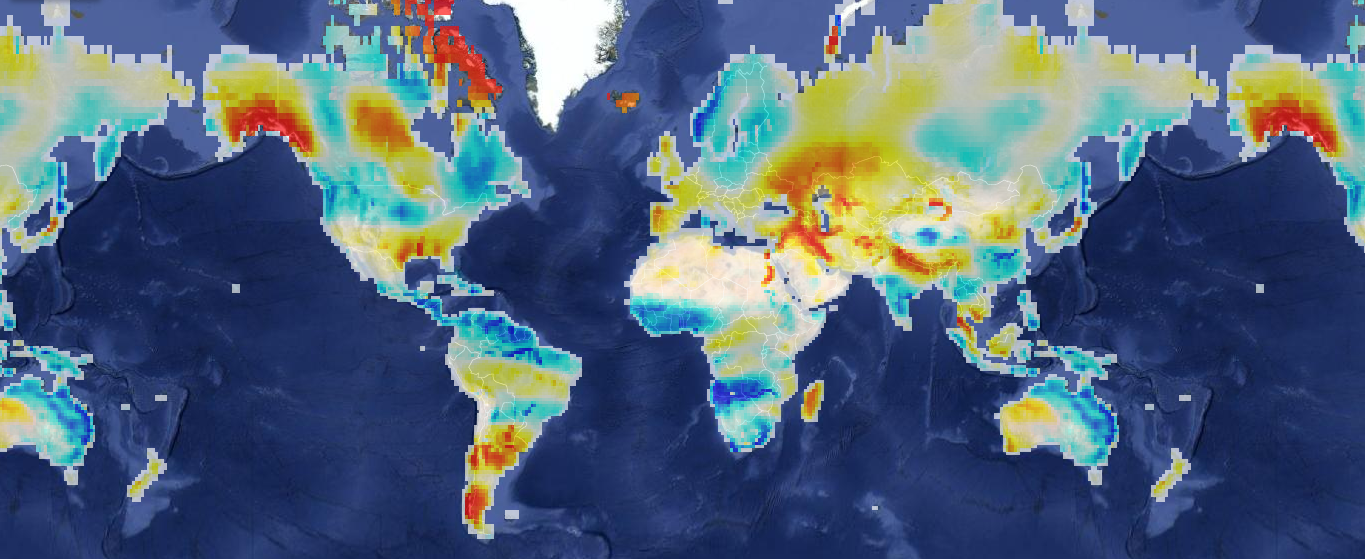
View global groundwater data in an inuitive format
We use Google Maps to display groundwater data from a variety of sources. Data from the GRACE project represents actual changes in groundwater from a 2002 baseline. The CLM plots show changes predicted by a sophisticated climate model: the Community Land Model. The Subtracted plots show differences between the predicted (CLM) and actual (GRACE) groundwater changes. Strong differences indicate greater direct human impact on groundwater.